Contents
##
Overview and origin
| Item | Details |
|---|---|
| Vietnamese name | Bộ chỉ tiêu thống kê phát triển bền vững của Việt Nam |
| English name | Vietnam's Sustainable Development Statistical Indicators (VSDG indicators) |
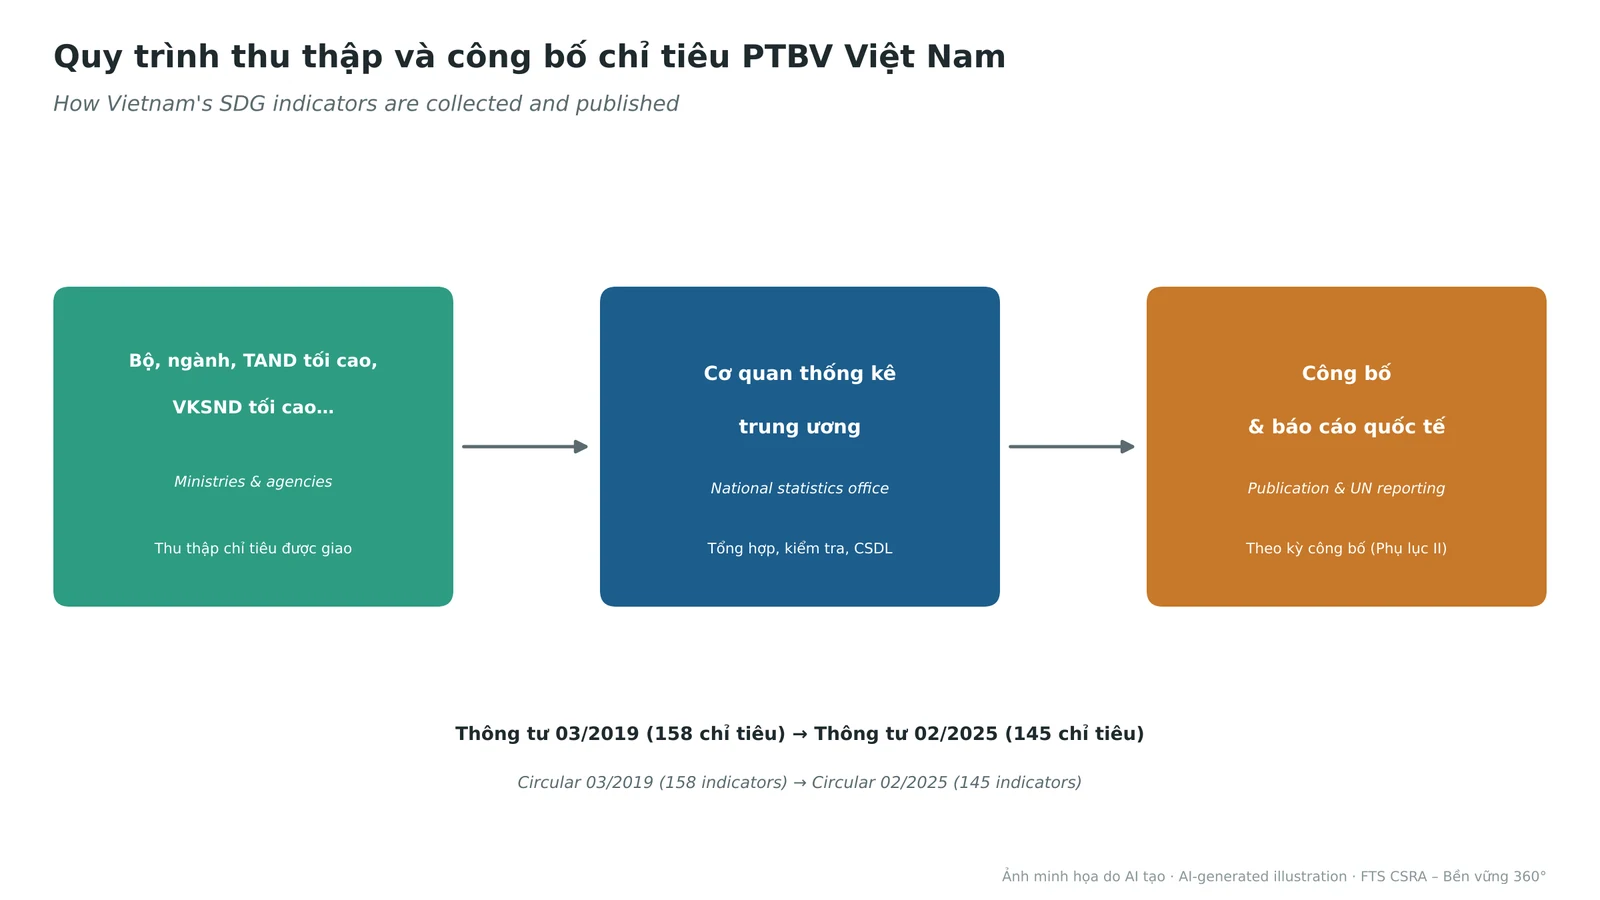
| Issuer / administrator | Issued under Circular 02/2025/TT-BKHDT of 3 January 2025 by the Ministry of Planning and Investment (statistics functions now sit under the Ministry of Finance after the 2025 restructuring). The national statistics office leads collection, compilation and publication. |
| Nature | A legal normative document on state statistics; it sets the list (Appendix I) and each indicator's content: concept, calculation, disaggregation, publication period, data source and responsible agency (Appendix II). |
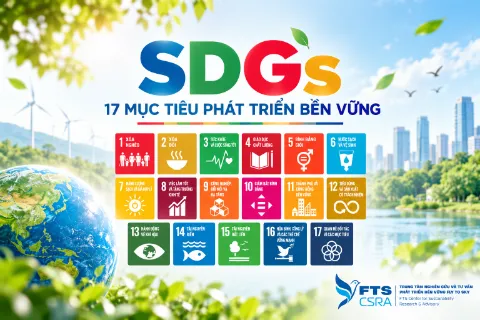
| Reference scope | Vietnam's 17 sustainable development goals (VSDGs); used to monitor and evaluate implementation of the 2030 Agenda and for international comparison. |
Circular 02/2025/TT-BKHDT took effect on 10 March 2025, replacing Circular 03/2019/TT-BKHDT of 22 January 2019 (158 indicators). The new set has 145 indicators, reviewed against the UN global indicator framework and the targets of the National Action Plan for the 2030 Agenda.
Purpose and main structure
Purpose: provide unified statistics to monitor and evaluate progress on Vietnam's sustainable development goals, for policymaking and international reporting. Codes follow Goal.Target.Number (e.g., 8.5.2 – Unemployment rate); a final letter (a, b, c…) marks Vietnam-specific additional indicators.
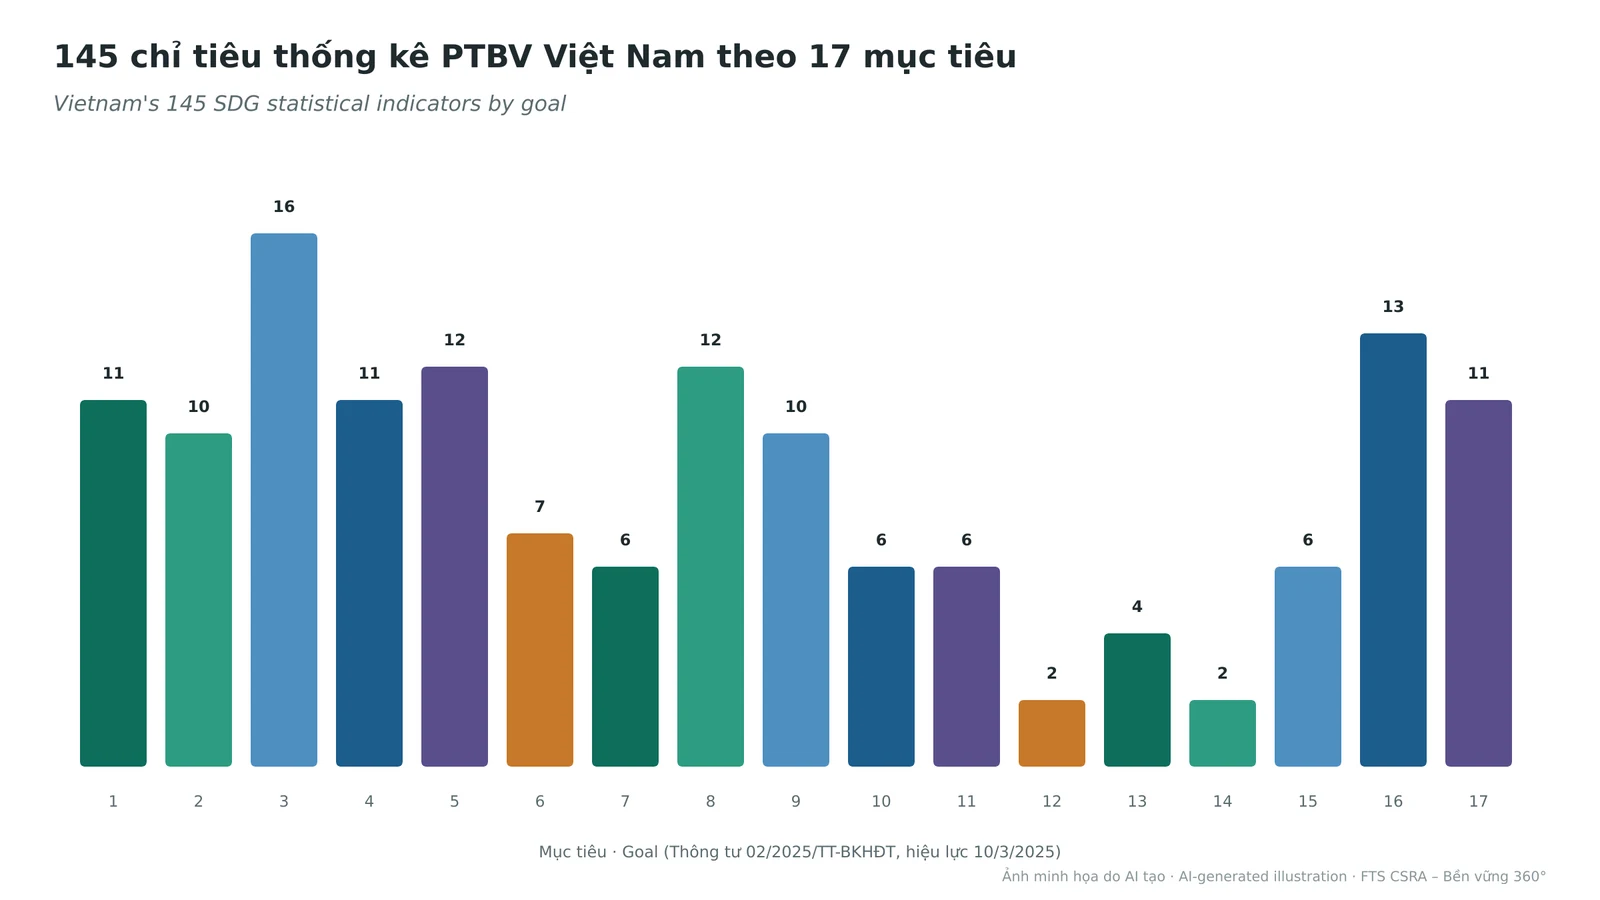
2.1. Full list of the 145 indicators
Indicator names follow Appendix I of Circular 02/2025/TT-BKHDT, translated by FTS CSRA; some long names are shortened, so check the original wording for official citations.
| Code | Indicator |
|---|---|
| Goal 1 – No poverty | |
| 1.1.1 | Population below the international poverty line |
| 1.2.1 | Multidimensional poverty rate |
| 1.2.2 | Multidimensional child poverty rate |
| 1.3.1.a | Workers covered by social insurance |
| 1.3.1.b | Workers covered by unemployment insurance |
| 1.3.1.c | Population covered by health insurance |
| 1.3.1.d | People receiving social, health and unemployment insurance benefits |
| 1.3.1.e | People receiving monthly social assistance in the community |
| 1.3.1.g | People receiving emergency social assistance |
| 1.3.1.h | People cared for in social protection facilities |
| 1.4.1 | Population in households with access to basic services |
| Goal 2 – Zero hunger | |
| 2.1.2 | Prevalence of food insecurity |
| 2.2.1 | Stunting among children under 5 |
| 2.2.2.a | Wasting among children under 5 |
| 2.2.2.b | Overweight and obesity among children under 5 |
| 2.3.1 | Labour productivity in agriculture, forestry and fisheries |
| 2.3.2 | Average income of agriculture, forestry and fisheries workers |
| 2.4.1 | Share of agricultural land under productive and sustainable use |
| 2.5.1.a | Plant genetic resources conserved |
| 2.5.1.b | Animal genetic resources conserved |
| 2.c.1 | Consumer price index for food |
| Goal 3 – Good health and well-being | |
| 3.1.1 | Maternal mortality ratio per 100,000 live births |
| 3.1.2 | Births attended by skilled health personnel |
| 3.2.1 | Under-5 mortality rate |
| 3.2.2.a | Infant mortality rate |
| 3.3.1.a | Detected people living with HIV per 100,000 population |
| 3.3.2 | Tuberculosis incidence per 100,000 population |
| 3.3.3 | Malaria incidence per 100,000 population |
| 3.5.2 | Harmful alcohol use among people aged 15+ |
| 3.6.1 | Road traffic accidents, deaths and injuries |
| 3.7.1 | Women 15–49 with family-planning needs met by modern methods |
| 3.7.2 | Adolescent birth rate (10–14; 15–19) |
| 3.8.1 | Coverage of essential health services |
| 3.8.2 | Population with large household health expenditure |
| 3.a.1 | Tobacco use among people aged 15+ |
| 3.b.1 | Children under 1 fully immunized |
| 3.c.1 | Health workers per 10,000 population |
| Goal 4 – Quality education | |
| 4.1.1 | School enrolment rate |
| 4.1.2 | Completion rate of primary, lower and upper secondary |
| 4.2.2 | Five-year-olds enrolled in kindergarten |
| 4.3.1.a | University students per 10,000 population |
| 4.3.1.b | Share of trained workers |
| 4.4.1 | People 15–64 with ICT skills |
| 4.5.1 | Gender parity index in education |
| 4.6.1 | Literacy rate, population 15+ |
| 4.7.1 | Schools teaching gender, violence-prevention and HIV content |
| 4.a.1 | Schools with electricity, internet and computers for learning |
| 4.c.1 | Teachers meeting the qualification standard |
| Goal 5 – Gender equality | |
| 5.1.1.a | Sex ratio at birth |
| 5.2.1 | Women and girls 15+ subjected to intimate-partner violence |
| 5.2.2 | Women and girls 15+ subjected to non-partner sexual violence |
| 5.3.1 | Women 20–24 first married before 15 and before 18 |
| 5.3.1.a | Child marriage rate |
| 5.4.1 | Time spent on unpaid domestic and care work |
| 5.5.1.a | Women in the National Assembly |
| 5.5.1.b | Women in People's Councils |
| 5.5.2 | Women in leadership positions |
| 5.6.1 | Women 15–49 making their own reproductive health decisions |
| 5.a.1 | Households with land-use certificates for farmland |
| 5.b.1 | People owning a mobile phone |
| Goal 6 – Clean water and sanitation | |
| 6.1.1 | Population using hygienic water sources |
| 6.2.1 | Population using hygienic toilets |
| 6.3.1 | Urban wastewater collected and treated to standard |
| 6.3.1.a | Industrial parks with compliant central wastewater treatment |
| 6.4.1.a | Large reservoirs monitored to maintain minimum flows |
| 6.4.1.b | Large reservoirs operated under inter-reservoir rules |
| 6.6.1.a | Ramsar sites established and recognised |
| Goal 7 – Affordable and clean energy | |
| 7.1.1 | Population with electricity |
| 7.1.2 | Households using clean fuels |
| 7.2.1 | Renewable share of final energy consumption |
| 7.3.1.a | Total primary energy supply per GDP |
| 7.3.1.b | Energy consumption relative to GDP |
| 7.b.1 | Installed renewable energy capacity |
| Goal 8 – Decent work and economic growth | |
| 8.1.1 | Growth rate of GDP per capita |
| 8.1.1.b | GDP growth rate |
| 8.2.1 | Labour productivity growth |
| 8.3.1 | Informal employment rate |
| 8.5.1 | Average income per employed worker |
| 8.5.2 | Unemployment rate |
| 8.6.1 | Youth 15–24 not in employment, education or training |
| 8.7.1 | Children 5–17 engaged in labour |
| 8.8.1 | People injured in occupational accidents |
| 8.9.1 | Tourism share of GDP |
| 8.10.1 | Bank branches and ATMs per 100,000 adults |
| 8.10.2 | Adults 15+ with an account at a bank or authorised provider |
| Goal 9 – Industry, innovation and infrastructure | |
| 9.1.2.a | Passenger volumes carried and passenger-km |
| 9.1.2.b | Freight volumes carried and tonne-km |
| 9.2.1.a | Manufacturing value added as share of GDP |
| 9.2.1.b | Manufacturing value added per capita (PPP) |
| 9.2.2 | Manufacturing employment share |
| 9.3.2 | SMEs with outstanding loans at credit institutions |
| 9.5.1 | R&D expenditure as share of GDP |
| 9.5.2 | Researchers per million population |
| 9.c.1 | Population covered by a mobile network |
| 9.c.2 | Households covered by fibre broadband |
| Goal 10 – Reduced inequalities | |
| 10.1.1.a | Income growth of the bottom 40% per capita |
| 10.1.1.b | Expenditure growth of the bottom 40% per capita |
| 10.2.1 | People living below 50% of median income |
| 10.4.1 | Labour share of GDP |
| 10.4.2 | Gini coefficient of income distribution |
| 10.7.1 | Recruitment cost borne by migrant workers vs. monthly income |
| Goal 11 – Sustainable cities and communities | |
| 11.1.1 | Population living in temporary housing |
| 11.5.1 | Disaster deaths, missing and injured per 100,000 |
| 11.5.2 | Economic losses from disasters |
| 11.6.1 | Urban municipal solid waste collected and treated |
| 11.8.1 | Communes meeting new-rural-area standards |
| 11.8.2 | Rural household solid waste collected and treated |
| Goal 12 – Responsible consumption and production | |
| 12.4.2 | Hazardous waste collected and treated |
| 12.4.3 | Contaminated land sites treated and restored |
| Goal 13 – Climate action | |
| 13.1.1 | Disaster deaths, missing and injured per 100,000 |
| 13.2.2 | Greenhouse gas emissions per capita |
| 13.3.1.a | GHG-emitting facilities with emission-reduction plans |
| 13.3.2 | Population reached with disaster-prevention awareness |
| Goal 14 – Life below water | |
| 14.1.1.a | Coastal water monitoring points meeting national standards |
| 14.5.1 | Marine and coastal protected areas as share of national waters |
| Goal 15 – Life on land | |
| 15.1.1 | Forest cover |
| 15.1.2 | Terrestrial protected areas as share of land area |
| 15.2.1.a | Forest area protected |
| 15.3.1 | Share of degraded land |
| 15.6.1 | Provinces participating in the national genetic resources database |
| 15.6.2 | Access and benefit-sharing applications |
| Goal 16 – Peace, justice and strong institutions | |
| 16.1.1 | Victims of intentional homicide per 100,000 |
| 16.1.3 | Population subjected to violence |
| 16.1.4 | Population feeling safe walking alone after dark |
| 16.2.1 | Children experiencing physical or psychological punishment by caregivers |
| 16.2.2 | Detected victims of human trafficking per 100,000 |
| 16.2.3 | People 18–29 who experienced sexual violence before 18 |
| 16.3.1 | Violence victims who reported to competent authorities |
| 16.4.2 | Illegal weapons, explosives and support tools seized |
| 16.5.1 | People paying informal charges for public services |
| 16.5.2 | Businesses paying informal charges for public services |
| 16.6.1 | State budget spending vs. approved estimates |
| 16.6.2 | Population satisfied with public services |
| 16.9.1 | Children under 5 with registered births |
| Goal 17 – Partnerships for the goals | |
| 17.1.1 | State budget revenue as share of GDP |
| 17.1.2 | Share of spending funded by tax revenue |
| 17.3.1.a | ODA and concessional loans from foreign donors |
| 17.3.1.b | Foreign investment into Vietnam |
| 17.4.1 | External debt service vs. exports of goods and services |
| 17.6.1 | Broadband internet subscriptions per 100 people |
| 17.8.1 | Internet users |
| 17.11.1 | Value of merchandise exports and imports |
| 17.17.1 | Public-private partnership projects |
| 17.19.1 | Birth registration rate |
| 17.19.2 | Death registration rate |
Who uses it and how
Implementers: the national statistics office leads; ministries, ministerial-level and government agencies, the Supreme People's Court and the Supreme People's Procuracy collect and compile their assigned indicators and submit them for consolidation and publication. Users: policymakers, provinces, researchers, international organizations, companies and civil society.
- Look up indicators relevant to your sector and location.
- Use published data as baseline and context when building a Theory of Change or materiality assessment.
- Choose matching company indicators to report your contribution (see table 3.1).
- Align definitions and methods with Appendix II so data is comparable.
- Present contributions by national indicator code in the sustainability report.
3.1. Linking national indicators to company indicators
| National indicator | Matching company indicator | Framework link |
|---|---|---|
| 1.3.1.a / 1.3.1.b | % of employees with social and unemployment insurance | CSI L15; GRI 401-2 |
| 4.3.1.b | % trained employees; average training hours | CSI I17; GRI 404-1 |
| 5.5.2 | % women in leadership and management | CSI I12, I13; GRI 405-1 |
| 6.3.1.a | % of wastewater treated to standard before discharge | CSI I33; GRI 303-4 |
| 7.2.1 / 7.3.1.b | % renewable energy; energy intensity | CSI I25, I26; GRI 103 (302) |
| 8.8.1 | People injured in occupational accidents | CSI I19; GRI 403-9 |
| 12.4.2 | % of hazardous waste collected and treated | CSI E5; GRI 306-3 |
| 13.3.1.a | Has a GHG emission-reduction plan | CSI E21; GRI 102-1 |
| 16.5.2 | No informal payments; anti-corruption policy | CSI G18; GRI 205 |
Practical example
Hypothetical case: Textile Company S (Nam Dinh), 3,000 workers, wants to present its contribution to Vietnam's SDGs in its 2026 sustainability report.
| Code | National indicator | Company data |
|---|---|---|
| 1.3.1.a | Workers covered by social insurance | 100% of contracted workers insured (compare with published provincial average) |
| 5.5.2 | Women in leadership positions | 42% of team-leader-and-above roles held by women |
| 8.8.1 | People injured in occupational accidents | 4 cases, down 50% year on year |
| 6.3.1.a | Industrial parks with compliant central wastewater treatment | Plant 100% connected to the park's central treatment plant |
| 13.3.1.a | GHG-emitting facilities with reduction plans | Inventory done; plan to cut emission intensity 15% by 2030 |
Notes for use in Vietnam
- Use the right version: from 10 March 2025 cite Circular 02/2025/TT-BKHDT; codes and names changed from Circular 03/2019.
- Focal agency: after the 2025 restructuring, check the current name of the statistics office and publication contact before citing.
- National vs. company indicators: a company does not “meet” a national indicator but contributes to it; state the scope clearly.
- Different publication periods: many indicators are annual, biennial or five-yearly (from censuses) – check Appendix II before using them as baselines.
- Link to international frameworks: codes follow the global SDG framework, making it easy to cross-reference GRI, IRIS+ and the SDG Impact Standards.
Method & scope
Content compiled and interpreted from FTS Impact Lab and documents of the issuing body; versions and sources should be verified before publication.
References
- Circular 02/2025/TT-BKHDT on Vietnam's Sustainable Development Statistical Indicators (Vietnamese) ↗ (accessed 2026-10-24)
- Government News – Vietnam's sustainable development statistical indicators (Vietnamese) ↗ (accessed 2026-10-24)
- VnEconomy – Vietnam's sustainable development through 145 indicators (Vietnamese) ↗ (accessed 2026-10-24)
- Cross-references: UN global SDG indicator framework; Decision 622/QD-TTg (2017); CSI Index; GRI (accessed 2026-10-24)